MetrixMundi

Life areas

Eleven areas of life. From the world to the municipality.

Every indicator belongs to exactly one of eleven topic areas – from population to digital. This way every area can be read at a glance as a profile, and every question can be traced to the right number.

How everything connects

One area, eleven topic areas, one order for all levels.

  • World
  • EU
  • Country
  • State
  • District
  • Municipality
  • Neighbourhood · locality

Levels

The same eleven topic areas apply at every level. A district is compared with all districts, a municipality with municipalities of similar size – and every level uses its parent level as a yardstick.

Official codes

Linking works through the keys of official statistics: country codes, EU NUTS regions, municipality keys and the 100 m grid of the census. This way figures from different sources fit together without guesswork.

From question to number

A question – such as “Is there enough care for tomorrow?” – leads to the topic area, the area to the indicator, the indicator to the source. Every number carries its source, data date and licence.

The eleven topic areas

What each area contains – with a real example.

In each case the example is the district of Merzig-Wadern in Saarland, compared with the state and Germany. In the Radar the same is shown for every district.

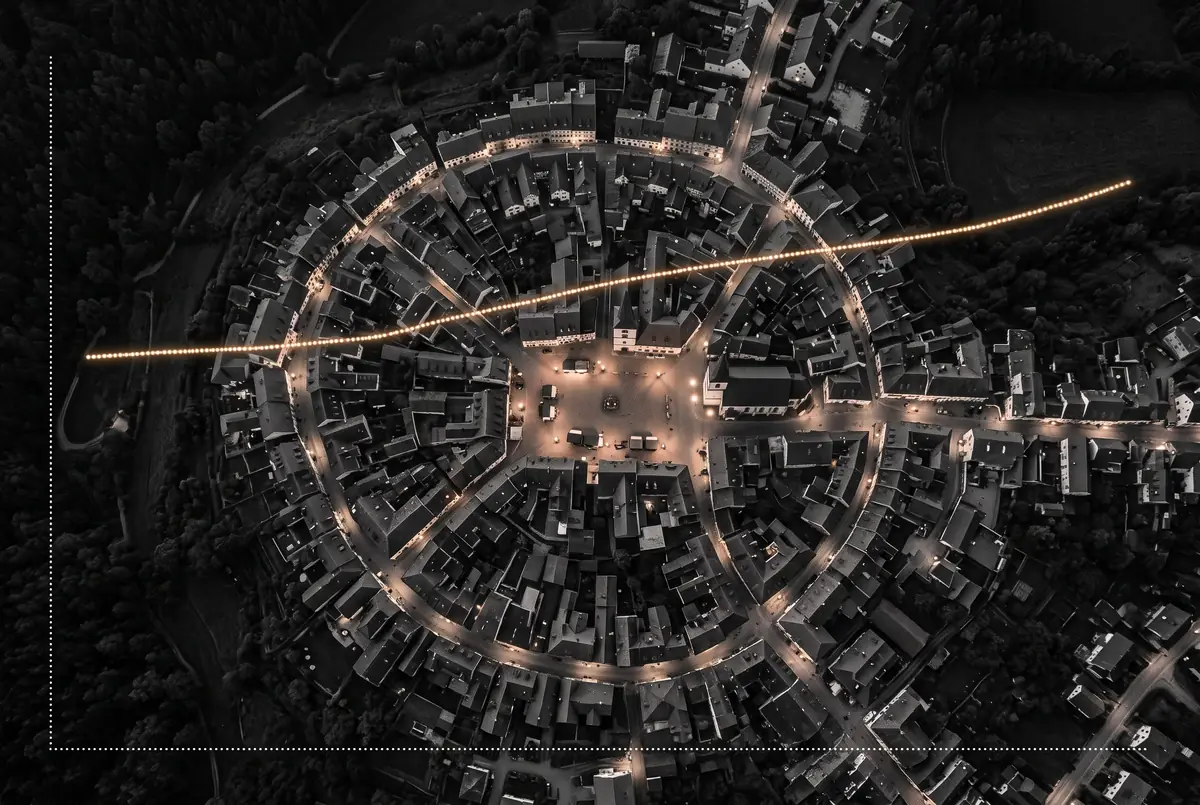
AI illustration: a small town at night with a rising population curve (not a real place)
AI illustration

Area 01

Population and society

How many people live here, how old they are, who moves in and who leaves – the basis for almost every other question.

“How will the population develop up to 2040 – and which age groups are growing?”

Net migration per 1,000 inhabitants

Merzig-Wadern9,8Saarland8,6Germany8,0

Source: Bertelsmann Stiftung, Wegweiser Kommune (CC0), data date 2023

13 indicators per district in the Radar. In-depth (in development): age structure as a pyramid, projection to 2040, migration by age, localities.
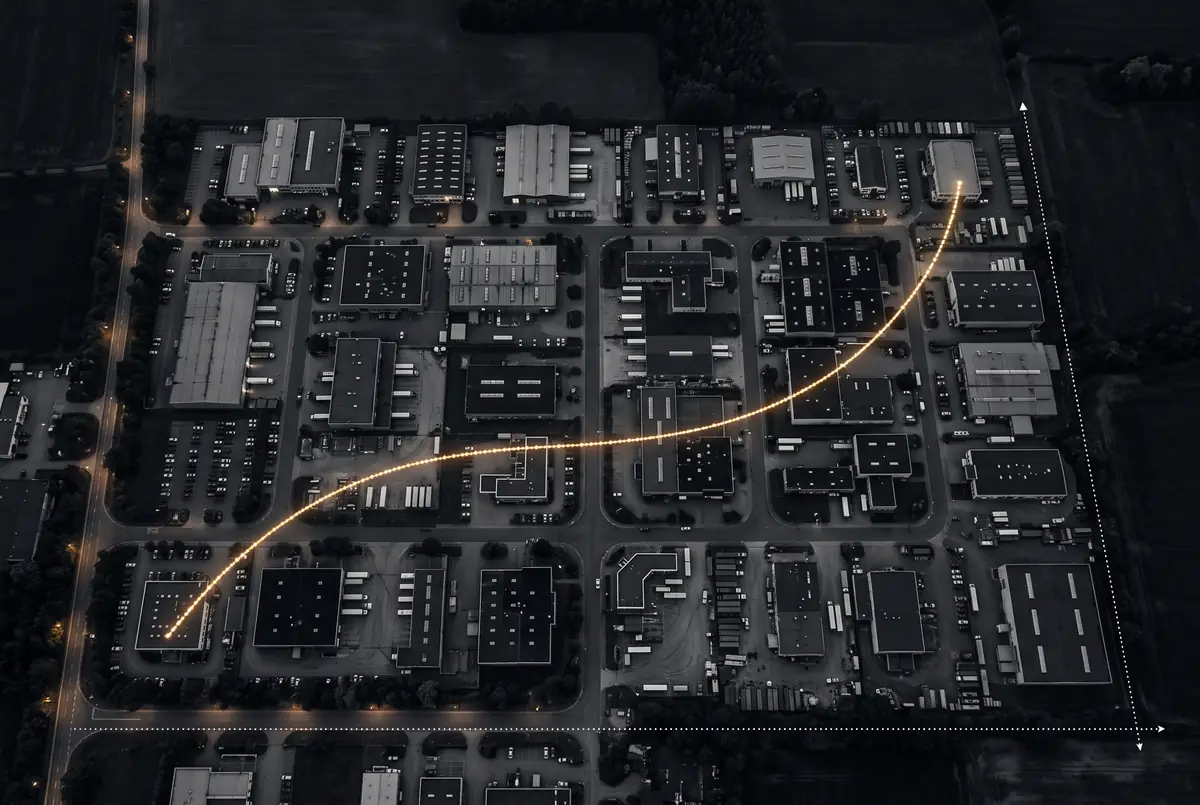
AI illustration: a business park at night with a data line (not a real place)
AI illustration

Topic area 02

Economy, work and income

What the region lives on: sectors, employment, income, commuters and economic strength in comparison.

“How many people depend on basic income support – and how has that changed?”

Share receiving basic income support (SGB II)

Merzig-Wadern6,4 %Saarland10,8 %Germany8,3 %

Source: Bertelsmann Stiftung, Wegweiser Kommune (CC0), data date 2023

19 indicators per district in the Radar. Deeper coverage (in development): sectors and largest employers, commuter flows, wages, business start-ups, cross-border commuters, economic twins in Europe.

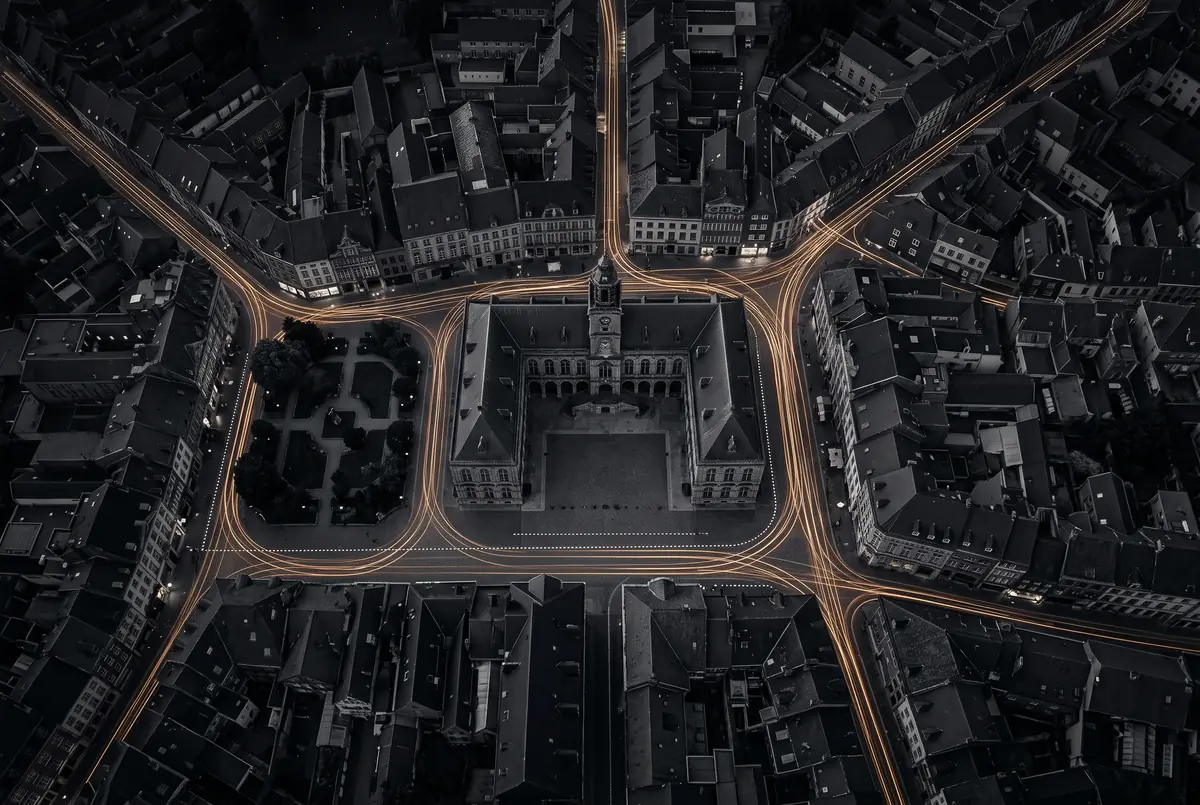
AI illustration: a town hall square at night with glowing connections (not a real place)
AI illustration

Area 03

State, finances and democracy

What the public sector takes in and spends, how much room for manoeuvre remains and how people vote.

“How strong is the tax base – and where does the budget stand by comparison?”

Tax revenue per inhabitant

Merzig-Wadern956 €Saarland1.217 €Germany1.566 €

Source: Bertelsmann Stiftung, Wegweiser Kommune (CC0), data date 2023

16 indicators per district in the Radar. In-depth (in development): budget over time, tax capacity and grants, funding, elections down to the polling district.

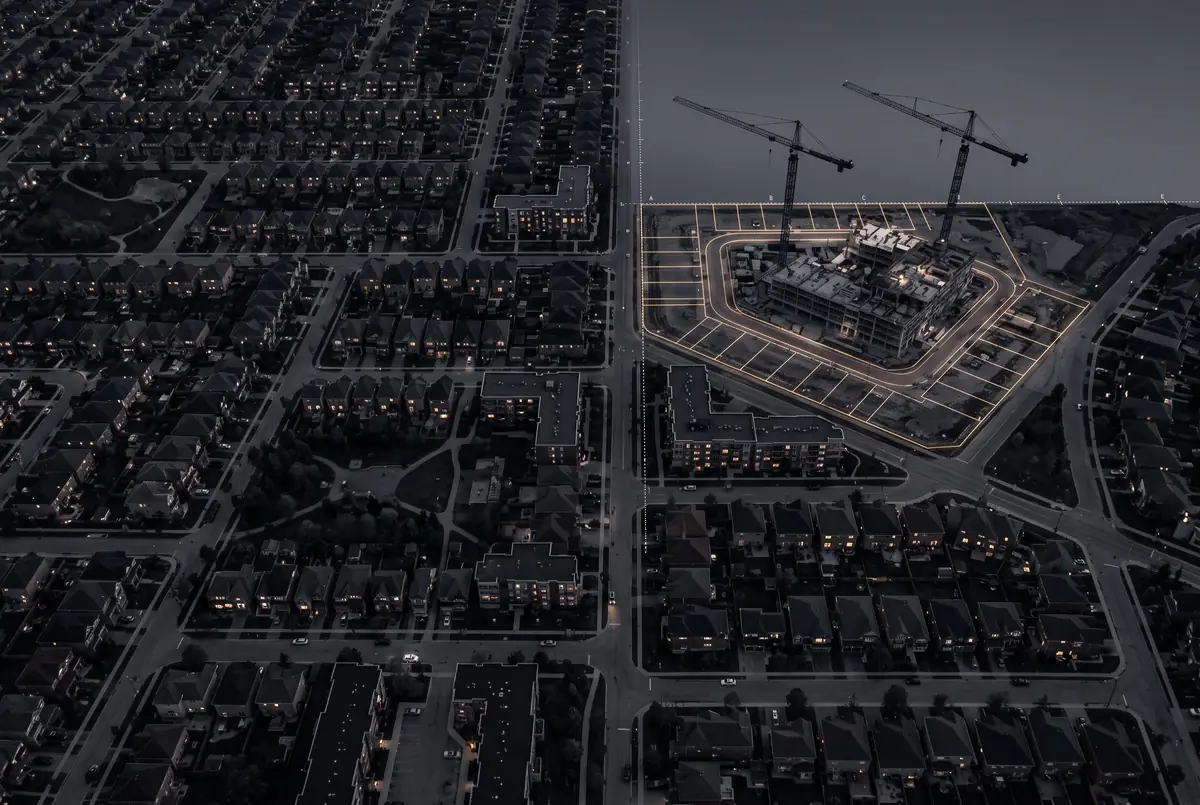
AI illustration: a residential area with a building site and cranes at dusk (not a real place)
AI illustration

Area 04

Housing and construction

How people live: floor space, building age, heating, new construction and vacancy – down to the 100 m grid.

“How much living space does each person have – and how old are the buildings?”

Living space per person

Merzig-Wadern57.8 m²Saarland53.4 m²Germany45.9 m²

Source: Bertelsmann Stiftung, Wegweiser Kommune (CC0), data date 2023

10 indicators per district in the Radar. In-depth coverage (in development): rents and prices by location, building age and heating in the 100 m grid, new construction, vacancy, housing demand.

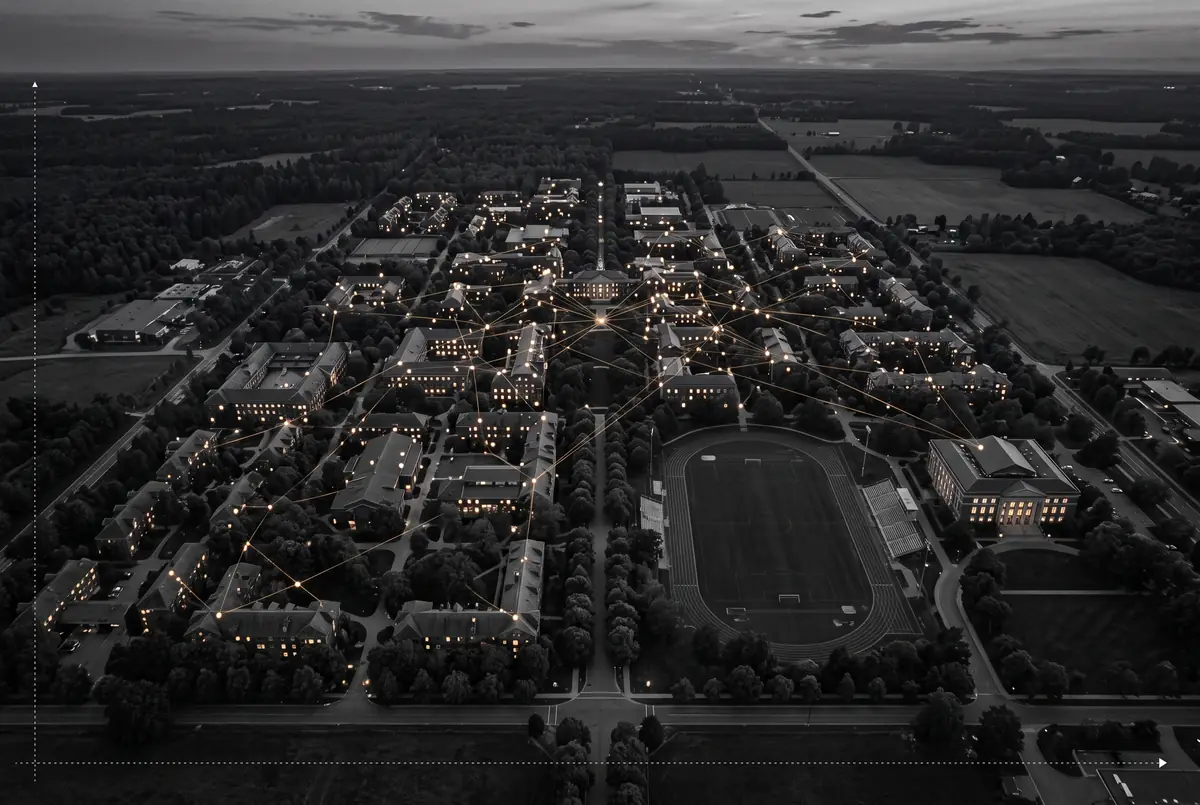
AI illustration: a school and university campus at dusk (not a real place)
AI illustration

Topic area 05

Education and research

From nursery to university: childcare, schools, qualifications and research on the spot.

“How many children under three are in childcare?”

Children under 3 in childcare

Merzig-Wadern33,5 %Saarland29,5 %Germany31,5 %

Source: Bertelsmann Stiftung, Wegweiser Kommune (CC0), data date 2023

13 indicators per district in the Radar. Deeper coverage (in development): schools and nurseries with accessibility, qualifications, universities, research and patents.

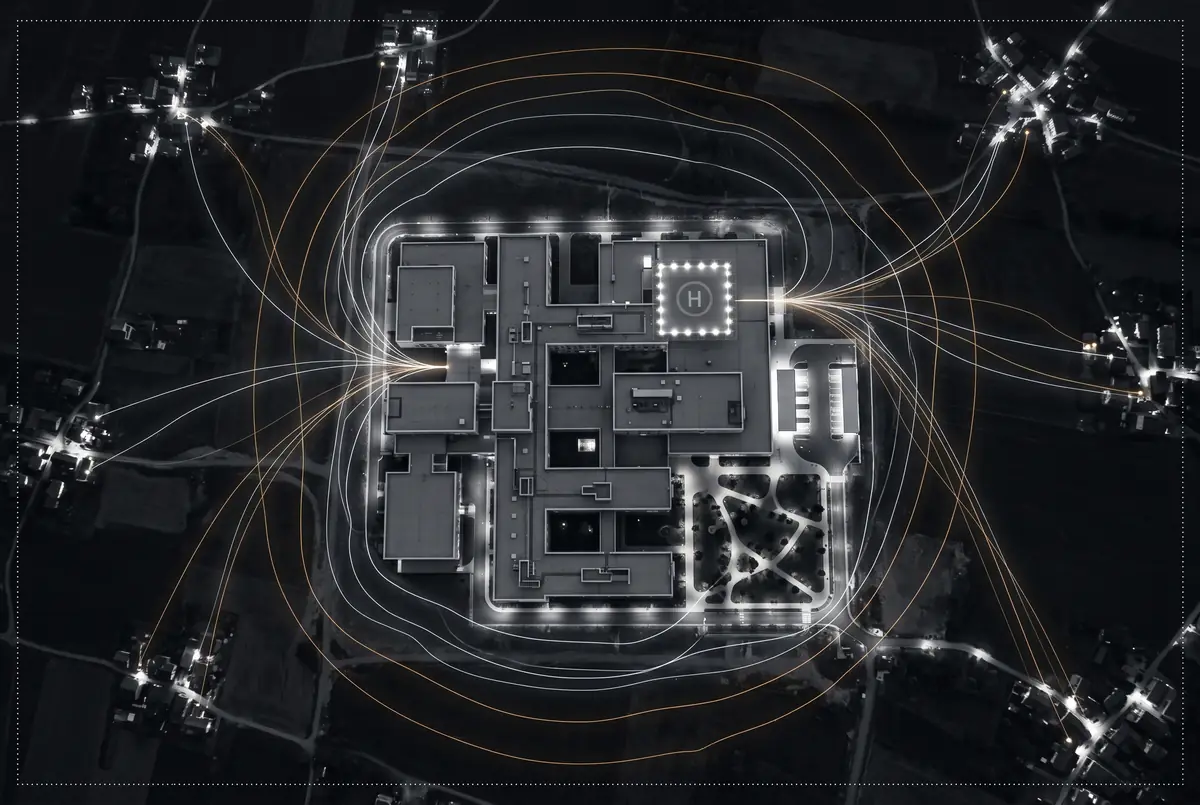
AI illustration: a hospital at night with travel-time lines from the villages (not a real place)
AI illustration

Area 06

Health and care

Doctors, hospitals, care places and life expectancy – and how quickly help arrives in an emergency.

“Are there enough care places for the ageing population?”

Places in care homes per 1,000 older people

Merzig-Wadern72,9Saarland57,9Germany52,9

Source: Bertelsmann Stiftung, Wegweiser Kommune (CC0), data date 2022

13 indicators per district in the Radar. Deeper coverage (in development): doctors by specialty, hospitals with travel time, care in detail, disease burden.

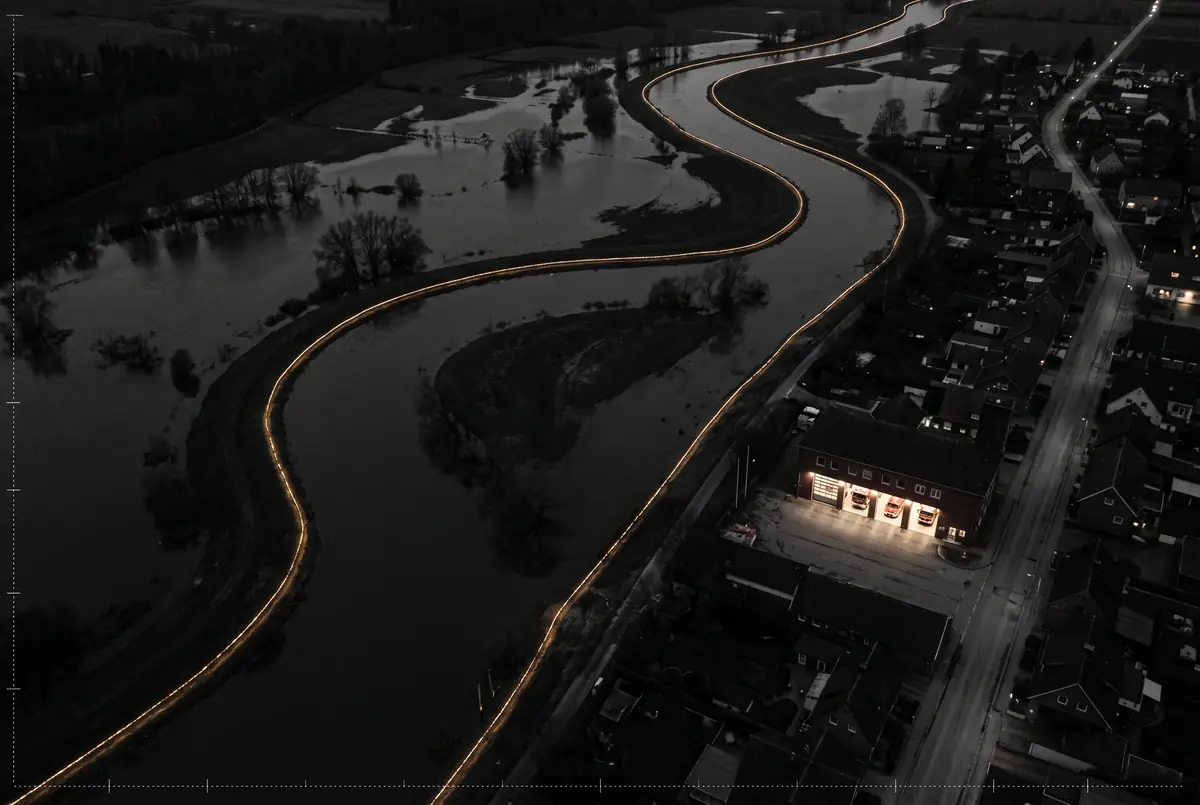
AI illustration: a river in flood and a fire station at night (not a real place)
AI illustration

Area 07

Safety and crises

Crime, accidents and natural hazards such as flooding, drought or forest fire – put into perspective soberly.

“How safe is the region by comparison – and what natural hazards are there?”

Offences per 1,000 inhabitants

Merzig-Wadern51,2Saarland72,6Germany68,3

Source: Bertelsmann Stiftung, Wegweiser Kommune (CC0), data date 2023

2 indicators per district in the Radar. In-depth coverage (in development): accident locations, crime by offence, natural hazards with warning levels yellow, orange, red.

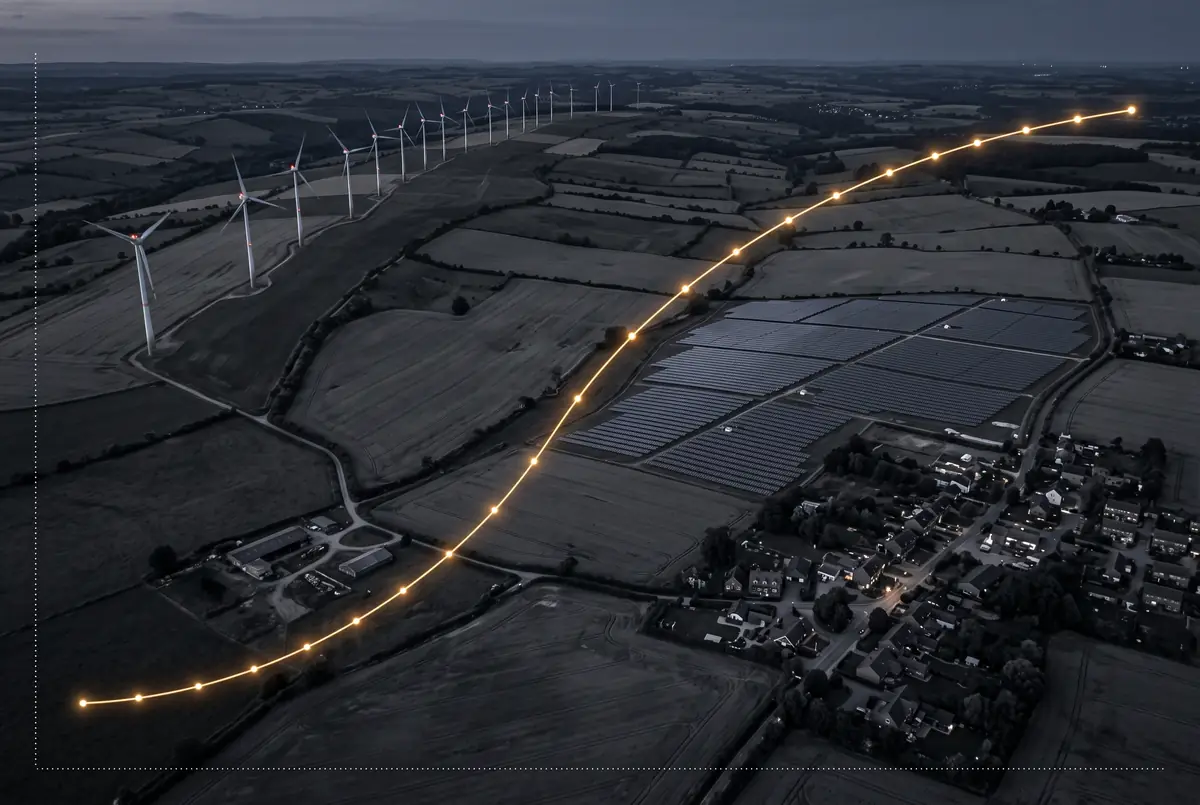
AI illustration: wind turbines and a solar park at dusk (not a real place)
AI illustration

Topic area 08

Climate and energy

How the climate is changing and how far the energy transition has come: heating systems, electricity, heat pumps, charging points.

“How many buildings still heat with oil – and what does that mean for heat planning?”

Buildings with oil heating (Census 2022)

Merzig-Wadern47,5 %Saarland27,8 %Germany18,6 %

Source: Zensus 2022, 100 m grid (dl-de/by-2.0), own aggregation, data date 2022

18 indicators per district in the Radar. Deeper coverage (in development): climate 1951–2100 on a 1 km grid, heat, frost, drought, wind and solar installations, heat planning.

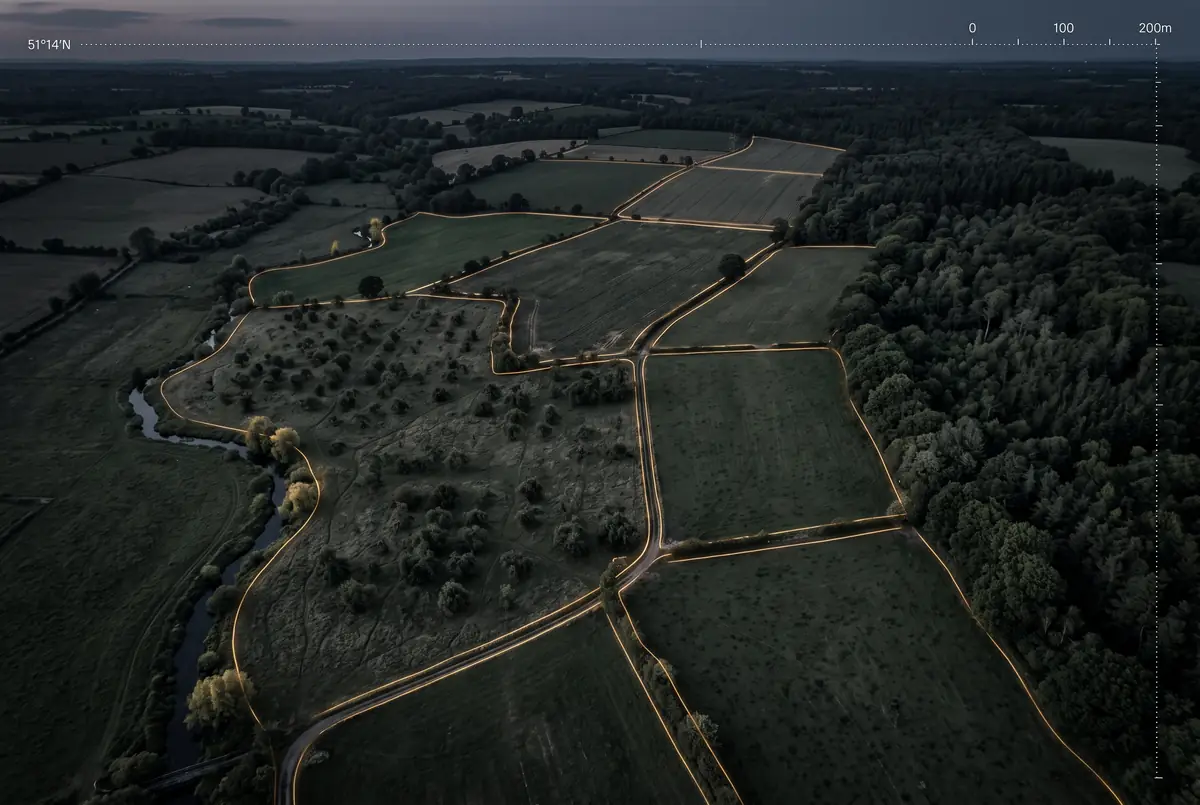
AI illustration: fields, an orchard meadow and a forest edge seen from above (not a real place)
AI illustration

Area 09

Nature, environment and agriculture

Forest, fields, orchards, soil sealing, air and noise – much of it from satellite data accurate down to the individual plot.

“How much forest has been lost since 2017?”

Forest loss 09/2017–10/2025 (share of forest area)

Merzig-Wadern9,0 %Saarland6,3 %Germany6,3 %

Source: DLR, forest loss (FCCL), © GeoBasis-DE / BKG, data date 2025

15 indicators per district in the Radar. In-depth (in development): forest loss and tree species, crops and mowing, soil sealing, air and noise as a map, protected areas.

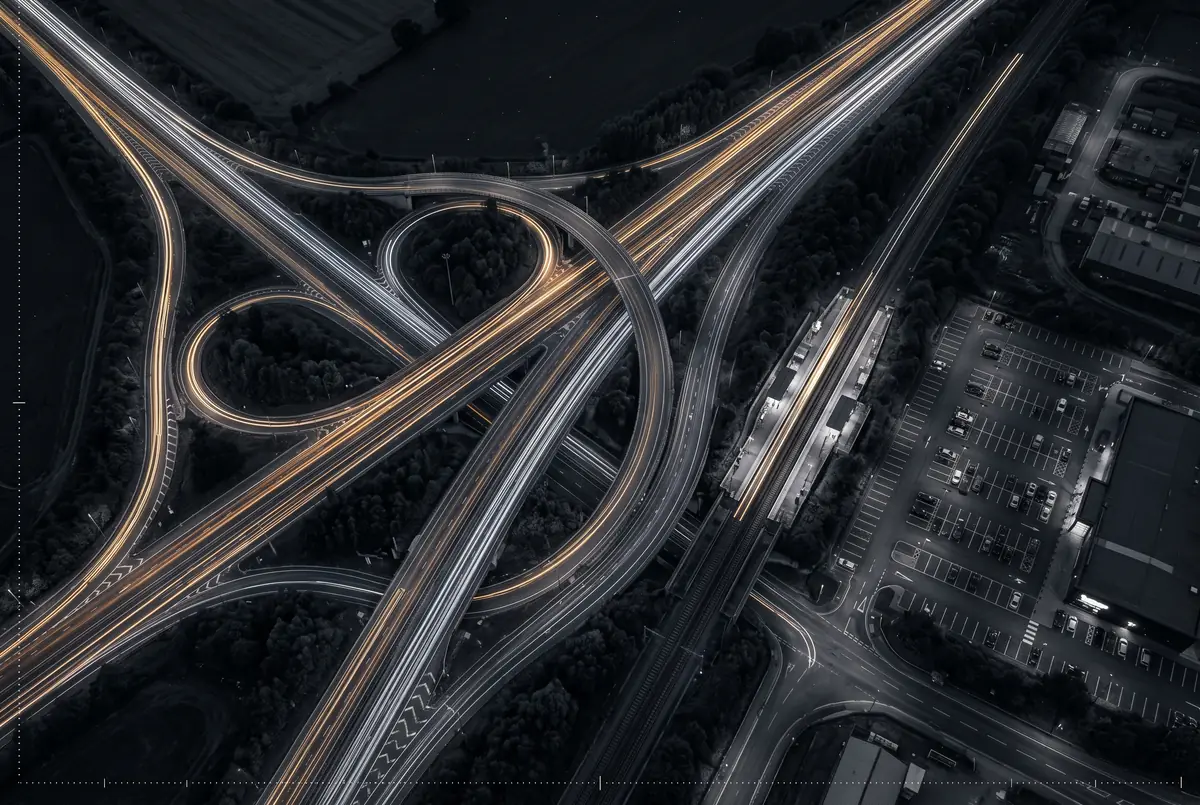
AI illustration: a motorway interchange with a rail line and light trails at night (not a real place)
AI illustration

Area 10

Mobility and services

How people get around and what is within reach: car, bus and rail, traffic volumes, local amenities, charging points.

“How dependent on the car is the region?”

Cars per 1,000 inhabitants

Merzig-Wadern698Saarland654Germany576

Source: Bertelsmann Stiftung, Wegweiser Kommune (CC0), data date 2023

6 indicators per district in the Radar. Deeper coverage (in development): bus and rail with frequency and journey time, rail punctuality, traffic volumes, local amenities per locality.

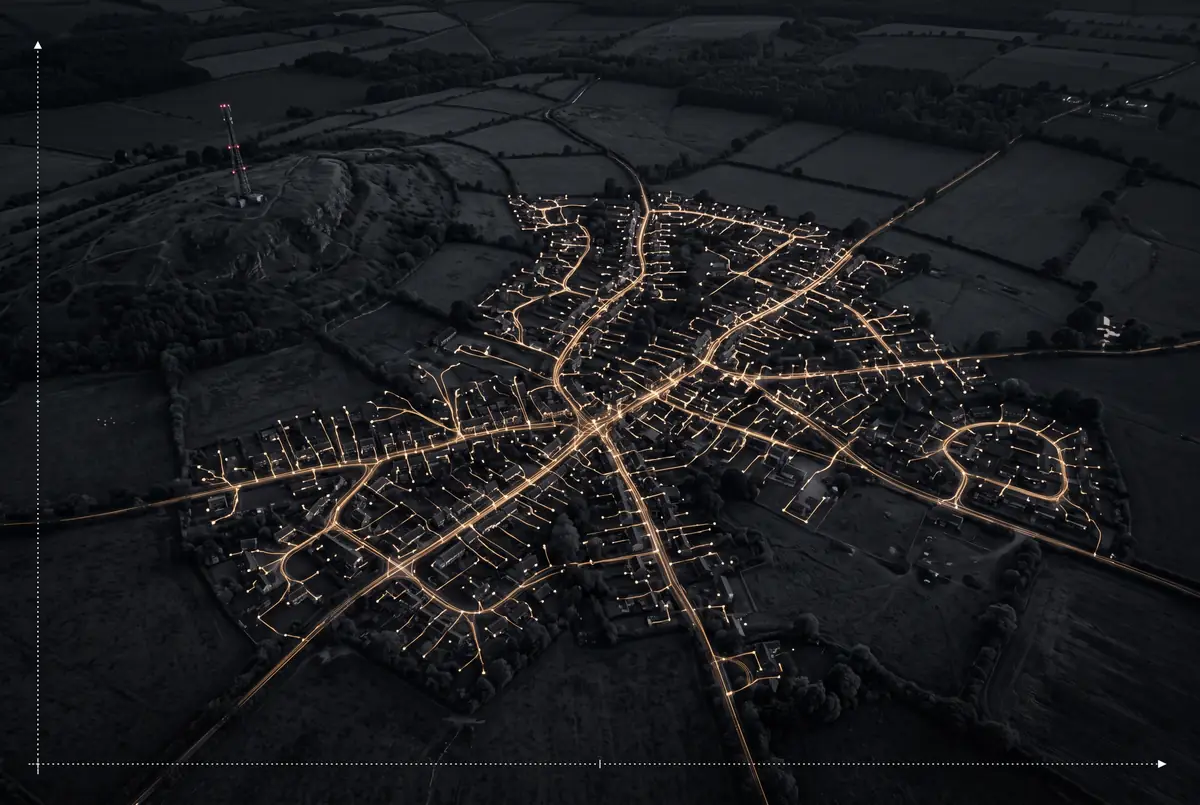
AI illustration: a village at night with a glowing fibre-optic network (not a real place)
AI illustration

Area 11

Digital and information

Fibre, mobile coverage and digital administration – who gets online quickly and where the coverage gaps are.

“How many households can get gigabit internet?”

Households with at least 1,000 Mbit/s

Merzig-Wadern73,3 %Saarland77,0 %Germany80,0 %

Source: Bundesnetzagentur, Gigabit-Grundbuch (dl-de/by-2.0), own calculation, data date 2025

8 indicators per district in the Radar. In-depth (in development): fibre, 4G and 5G on a 100 m grid, measured speed, coverage gaps, digital administration.

Your area

All eleven topic areas for your region.

In the open Online Radar you can see the profile of every EU country, every state and every district – free of charge.

Open the Online RadarSample reports