
Country · EU-27
Country Radar Germany
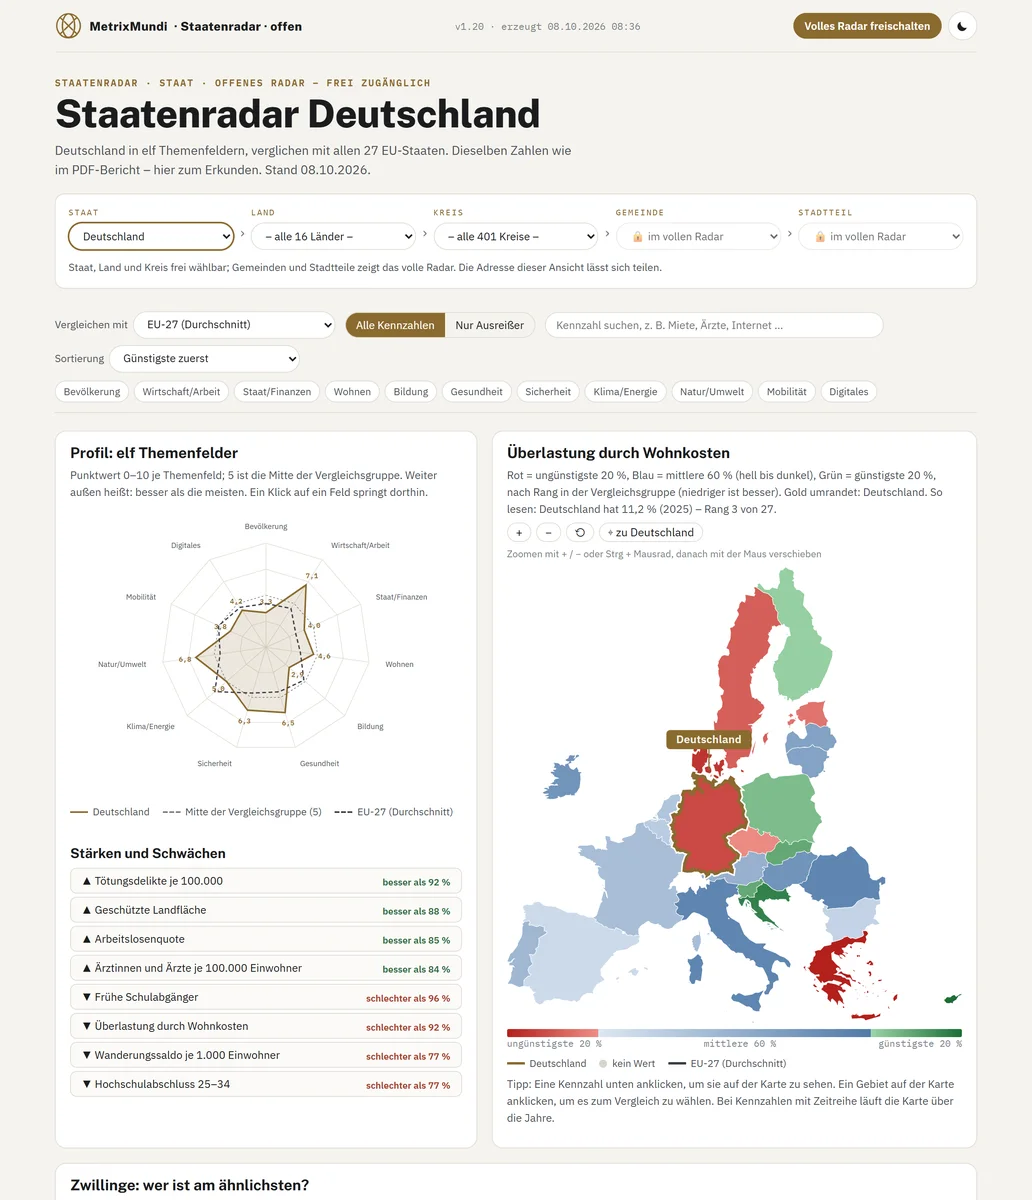
Each of the 27 EU countries compared with all the others and the EU average – housing, work, health, climate and more.
Online Radar and reports
The Online Radar shows every area interactively, from Europe down to the neighbourhood. The reports summarise the same thing as a PDF – with the source on every number. Everything on this page is a sample; content and design keep growing.
Online Radar
With the level bar you move from country through state and district down to the municipality or neighbourhood. Each level shows the profile of the eleven life areas, a map, time series and twins.
Country · EU-27
Each of the 27 EU countries compared with all the others and the EU average – housing, work, health, climate and more.
Federal state · 16 states
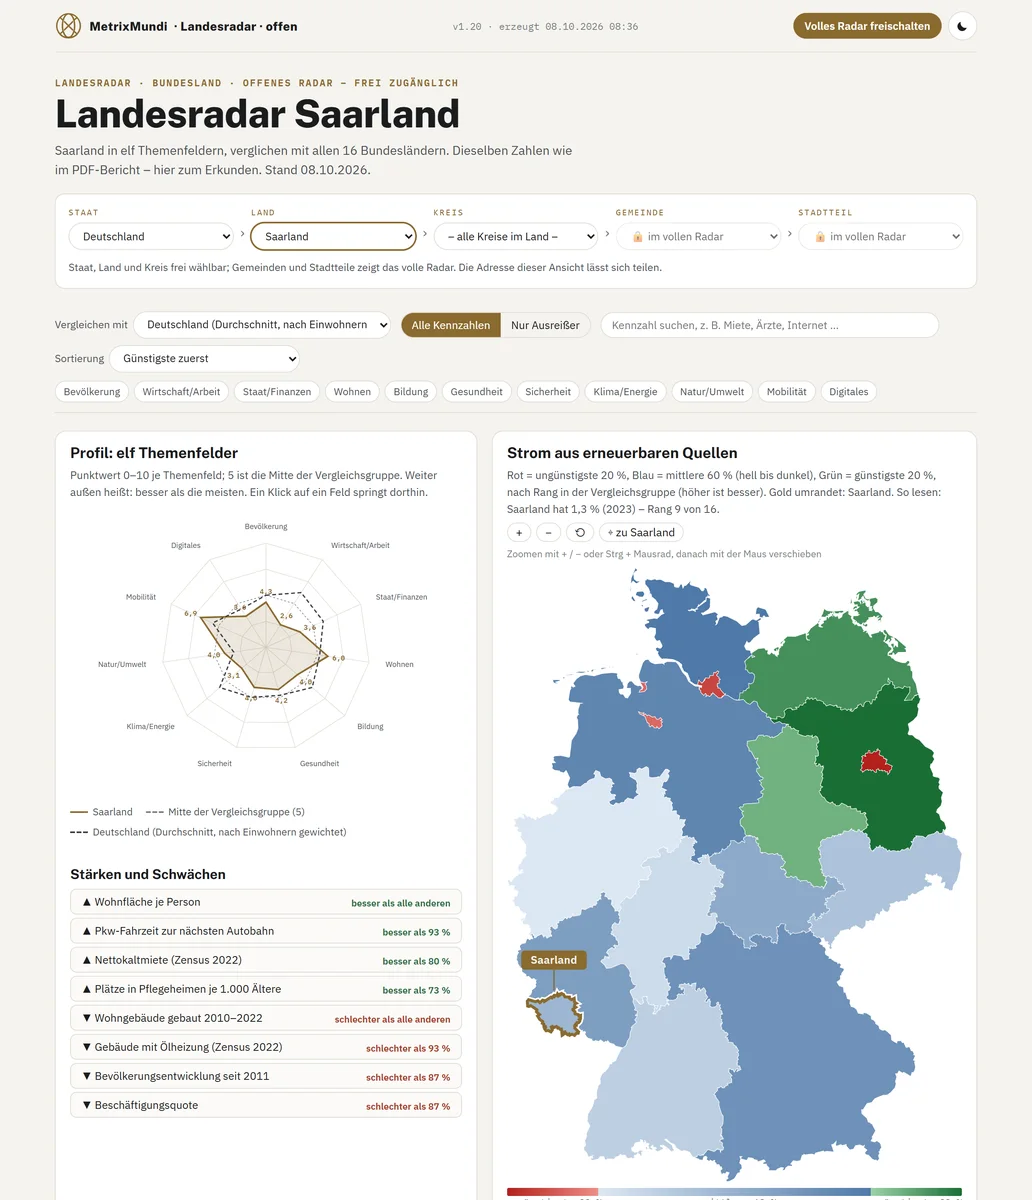
Each of the 16 states compared with all the others and the German average, with twins in Germany and Europe.
District · 401 districts
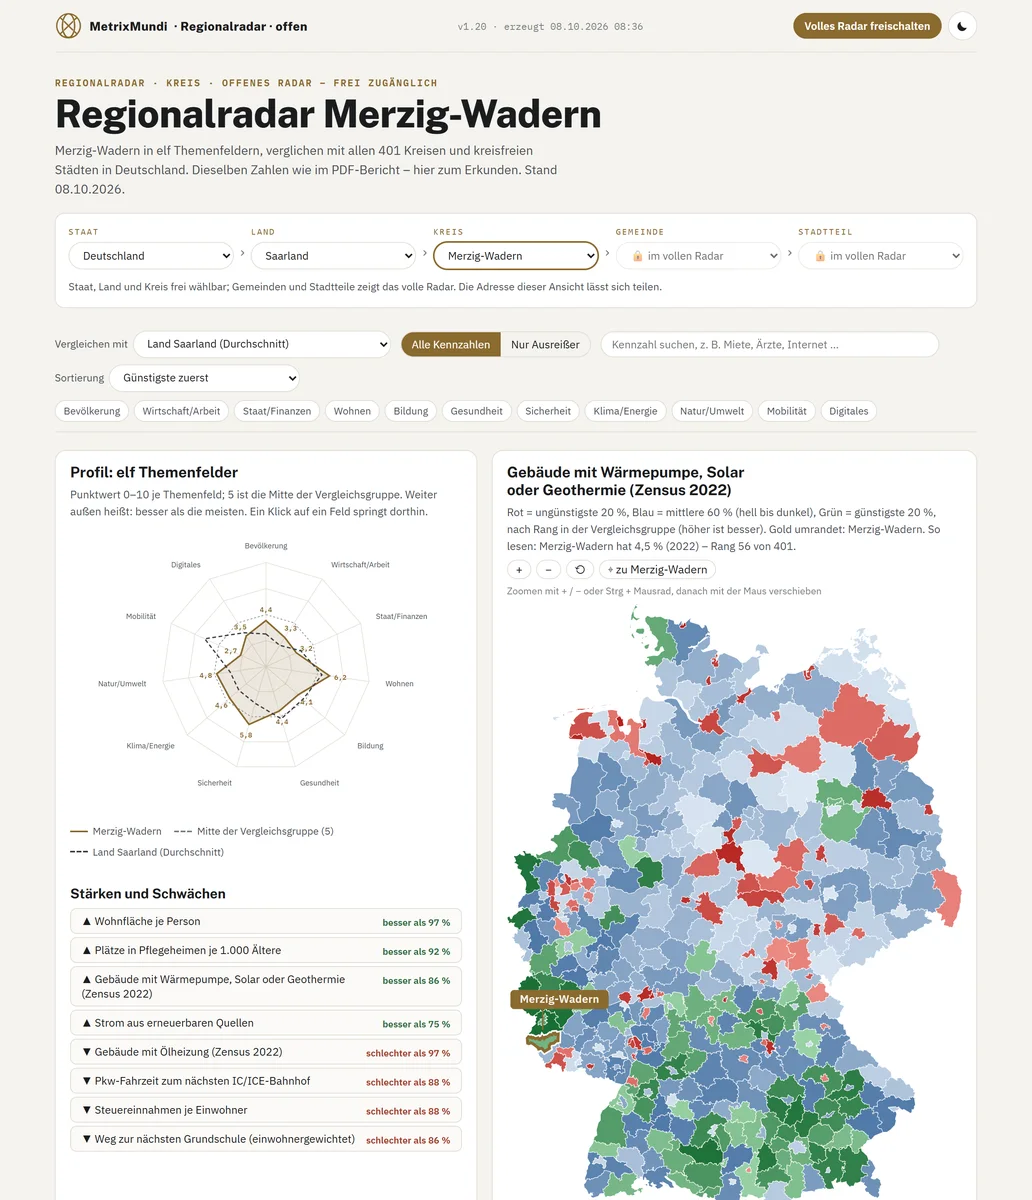
Every one of the 401 districts compared with all districts, the state and Germany – down to the map of all districts.
Municipality · around 10,800
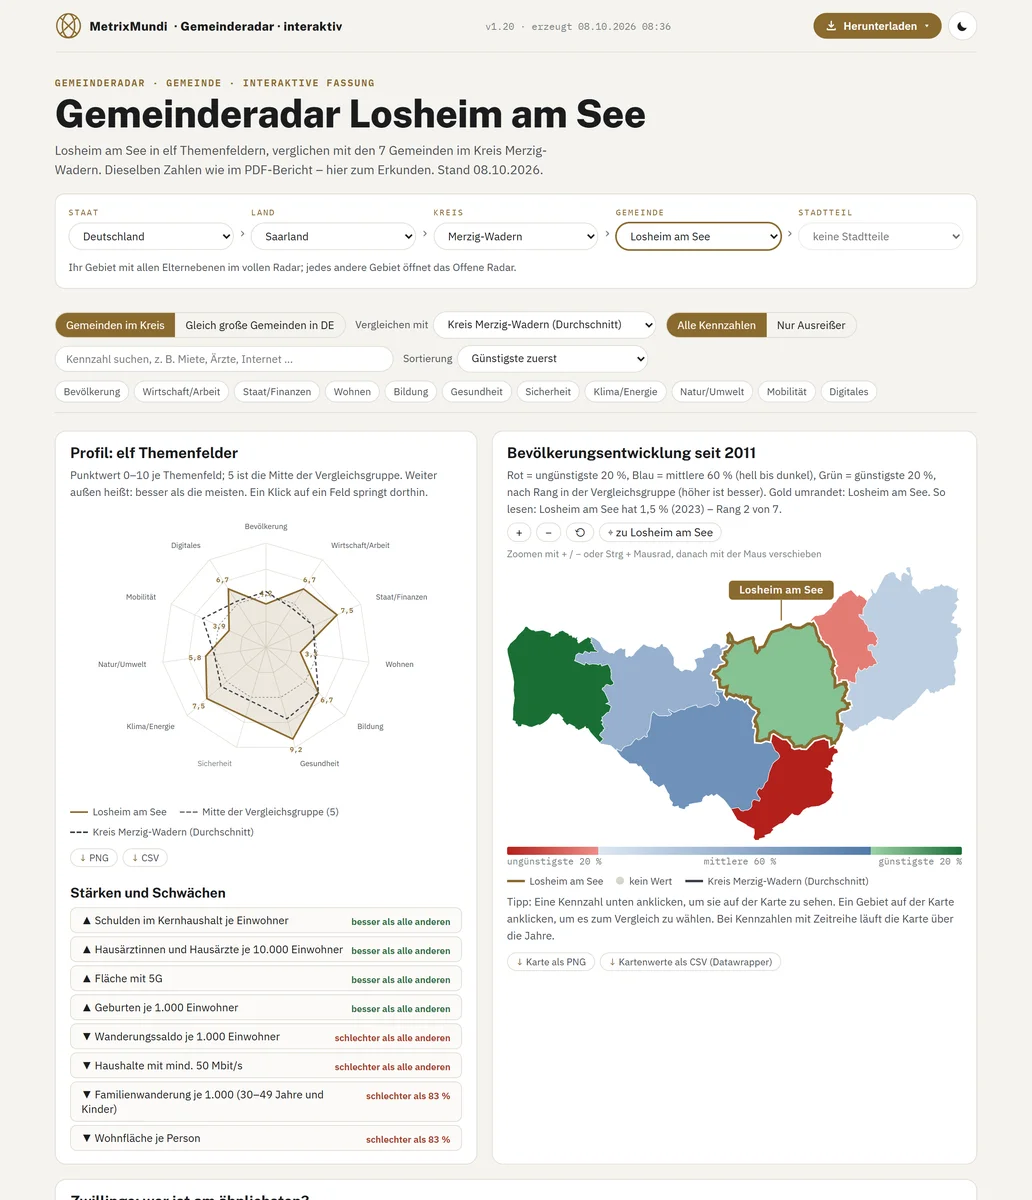
A municipality compared with the municipalities in its district and all municipalities of the same size in Germany, down to the localities.
Neighbourhood · Hamburg first
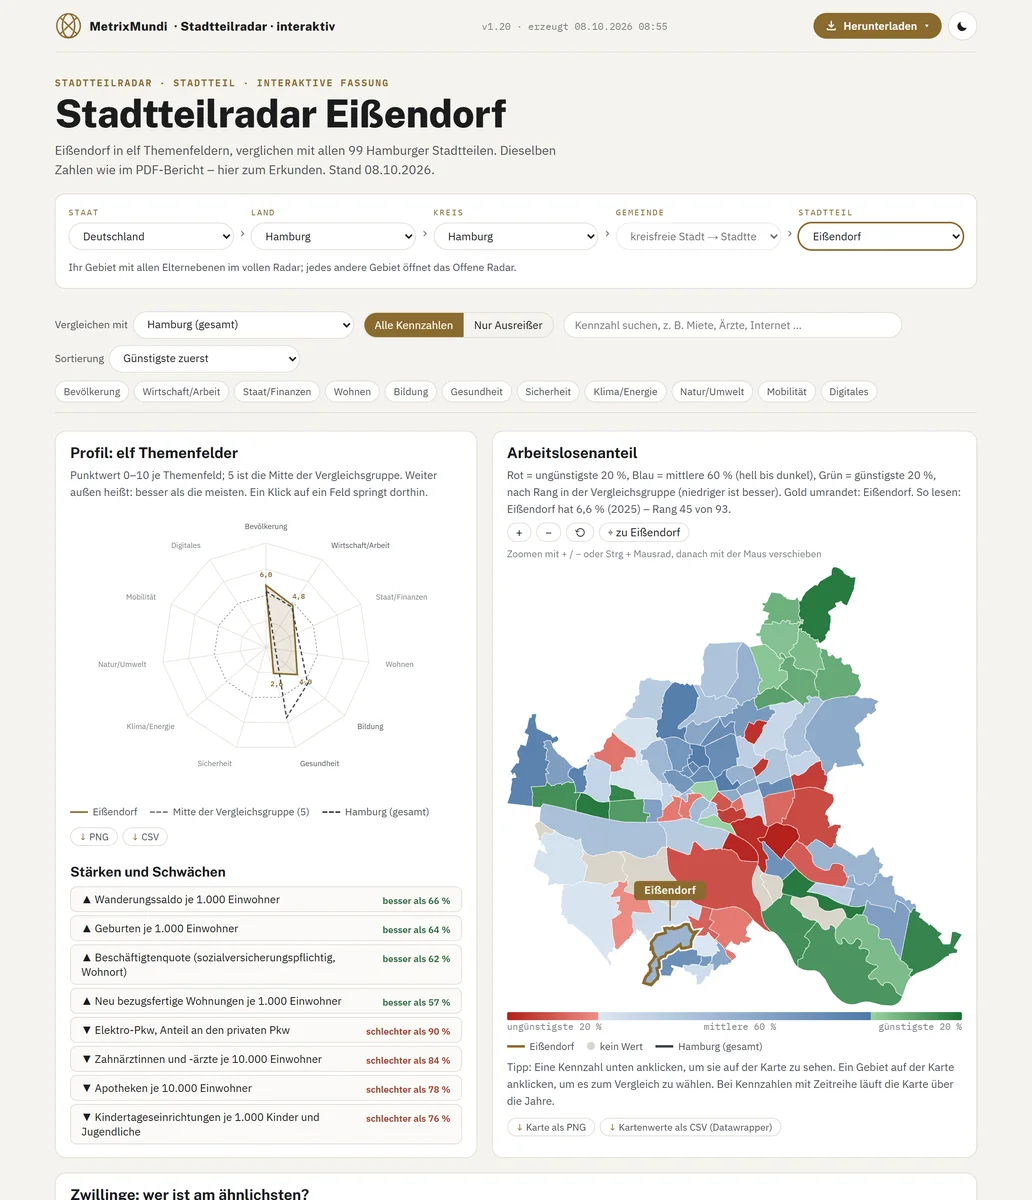
A neighbourhood compared with all neighbourhoods of the city; twins among neighbourhoods and municipalities across Germany.
Open or full
The open Radar answers the question “Where does my region stand?”. The full Radar is made for working with the data: all figures, every comparison, downloads and the PDF report.
| Component | Open Radar · free | Full Radar · 12 months |
|---|---|---|
| Levels | Country, state and district | plus municipalities and neighbourhoods in the booked area |
| Indicators with values | the three key indicators per topic area – 32 in the district | all indicators of the level – 133 for a district |
| Further indicators | expandable, with names and a padlock, without a value – 101 further for a district | with value, chart, time series and source |
| Scope · example Merzig-Wadern | 32 indicators · 104 own values · data value 80 | 164 indicators · 563 own values · 55.995 comparison values · data value 458 (with Saarland and Deutschland) |
| Comparison | with the averages for Germany and the EU | with every area at that level, the state, Germany and the EU – plus the areas below as dots |
| Rank | Assessment: upper, middle or lower third | exact rank among all comparison areas |
| Map | all areas coloured, value for your own area | values of all areas, time axis on the map |
| Time series | the three key indicators, one of them animated | every indicator as a time series, with median and 80% band |
| Statistical twins | as dots in the compass, without names | with names: status, trend and true twins in Germany and Europe |
| Strengths and weaknesses | the two most important | all, sortable |
| Downloads | Screenshot with source line | PDF, Excel/CSV and charts – depending on licence level |
| PDF report | – | included, for your area |
| Updates | Status of the open pages | all new data releases for twelve months |
PDF reports
Each report describes one area in eleven areas of life, compared with all comparable areas and with a source on every number – to pass on and keep. The State and Country Radar follow the same structure.
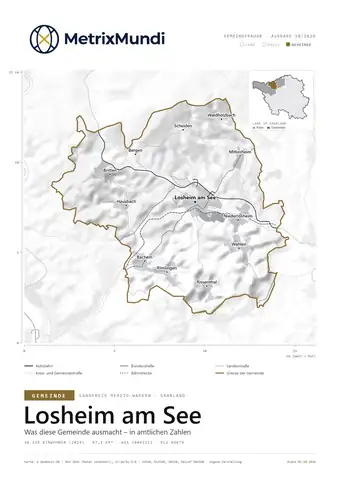
Municipality and localities
A municipality across eleven topic areas, compared with all municipalities of similar size in Germany and the neighbours in the district. Maps down to the localities, twins and a chapter on what makes the municipality unique.
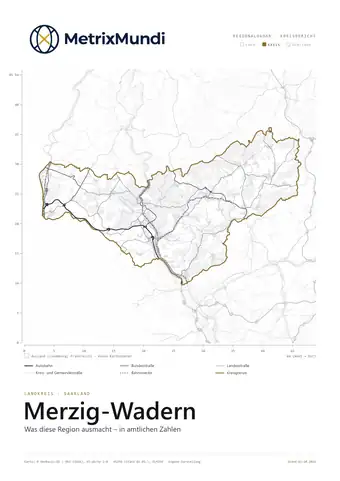
District and district-free city
A district compared with all 401 districts, its state and Germany. From “What the region is known for” through trends and twins down to the details, with a source on every number.
What makes this area what it is – in official figures.
Five surprising findings, each with evidence.
The profile of the eleven areas of life with strengths and weaknesses.
What has changed – and where the tipping points lie.
Who else in Germany and Europe is in exactly the same position.
Every indicator with comparison, time series, source and data date.
Focus reports
For every area from district level upwards there are focus reports that treat a topic in more depth than the basic report – as a PDF or as additional chapters in the full Radar.
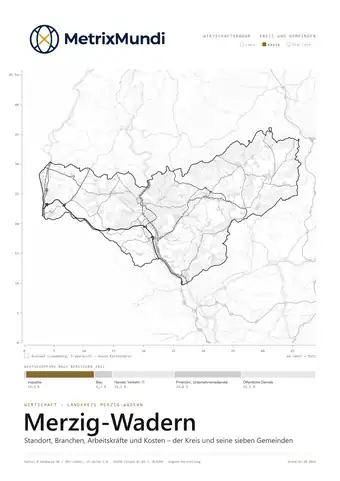
Economic structure and location: sectors, employees, commuters, start-ups, cross-border commuters and economic twins in Europe.
For: economic development, businesses, consulting
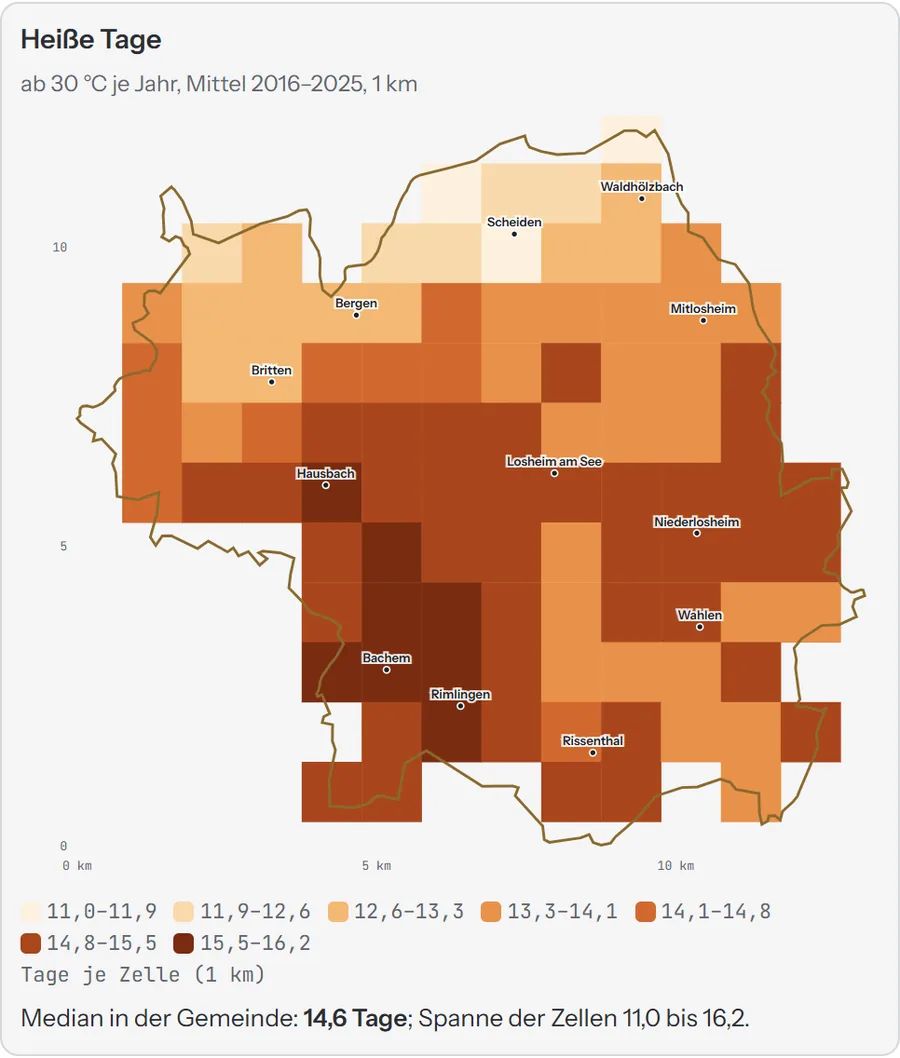
Climate from 1951 to 2100 on a 1 km grid, heat, frost and drought, plus the local energy transition: solar, wind, heating systems, heat planning.
For: climate protection, heat planning, press
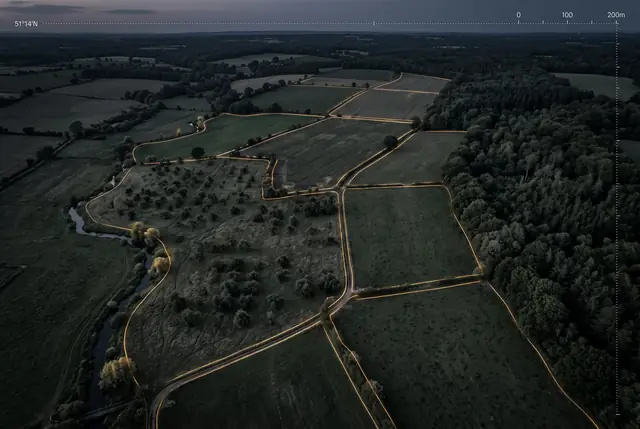
Forest and forest loss, crops, orchard meadows, rainfall in the growing season, frost and heat days – from satellite and weather data.
For: agriculture, horticulture, nature conservation
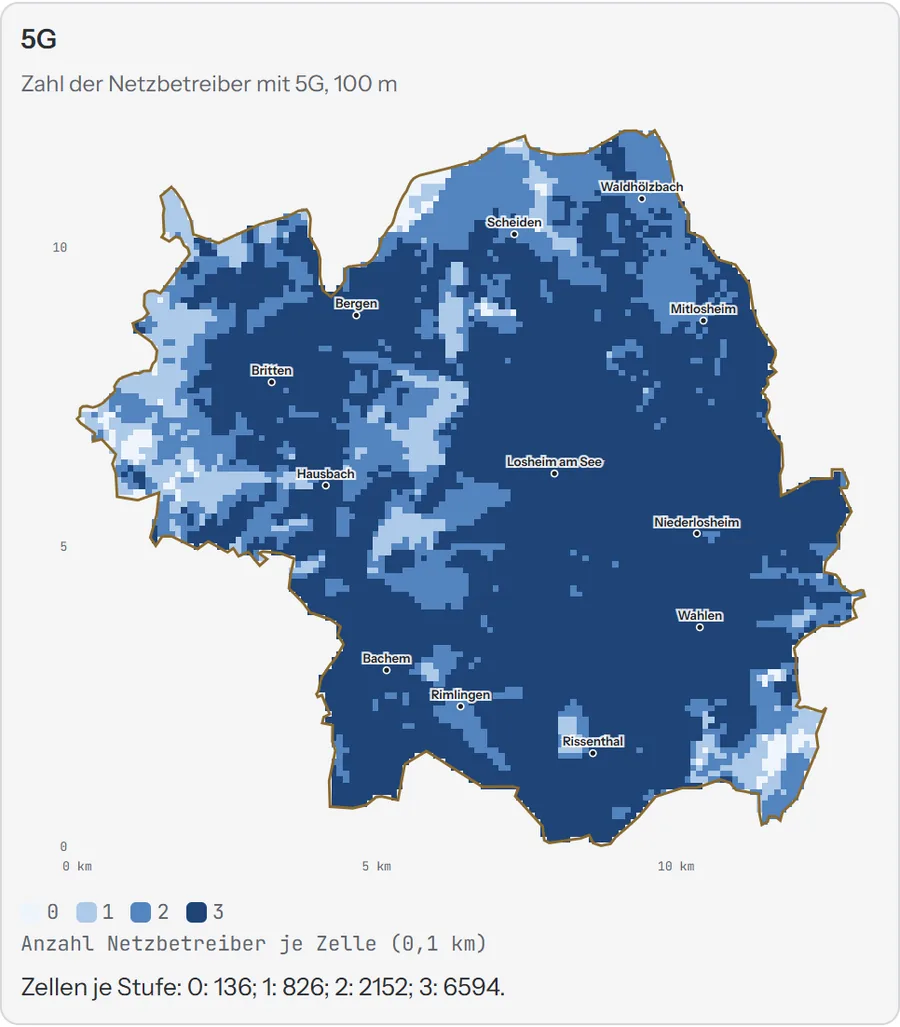
Fibre, 4G and 5G on a 100 m grid, measured speed and coverage gaps down to the localities.
For: administration, broadband coordination, businesses
Sample · as of October 2026 · further focus reports to follow
Get started
The open Radar is free. You can pre-register for a report and the full Radar – we will contact you at launch with the prices.