MetrixMundi
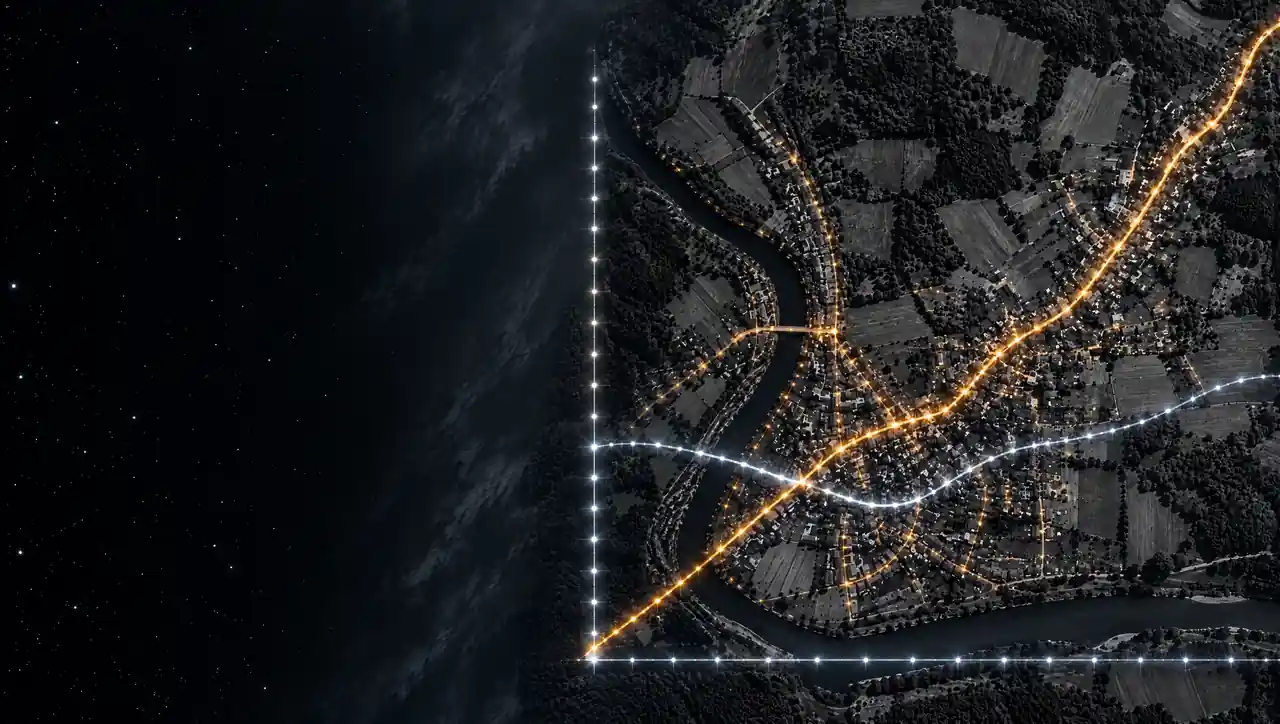
Aerial view of a town at night; its streets form a line chart with a gold and a silver curve. AI-generated.

Facts, statistics and analysis

When numbers count. 
Global and local.

In the digital age, the number of data sources is practically unlimited — but which ones are relevant and trustworthy? MetrixMundi reviews the available sources and brings data together securely and clearly.
Professional – with details of the source and terms of reuse.

Explore your region – free of chargeFULL DATA ACCESS – PRICES

AI-generated image · not a real place

Why facts

Truth is the benchmark.

False reports, targeted manipulation, propaganda: anyone who needs information today needs a foundation that is 100% reliable. MetrixMundi provides it. Every number comes from an official or verified source, is processed with statistical rigour and carries its evidence with it.

For public administration, companies, consultants, politicians, journalists, pupils/students and all other interested citizens: base your decisions on what has been measured. Not on what is claimed the loudest.

Evidenced
On every number: source, data date and licence – in the PDF and in the Online Radar alike.
Official and verified
Official bodies first – Destatis, Eurostat, OECD, World Bank, UN – plus verified open data. Every source is listed with its licence in the public catalogue.
Statistically sound
Like is compared only with like, ranges instead of single values, forecasts clearly labelled.
Transparent
Calculations are open, limits are stated. What we do not know is stated alongside.
Five levels deep
From the world down to the municipality, one yardstick. Only what is comparable is compared – with reasons given.
Free to use
Depending on what you book: read, process, publish. No subscription. A source line is part of every chart.

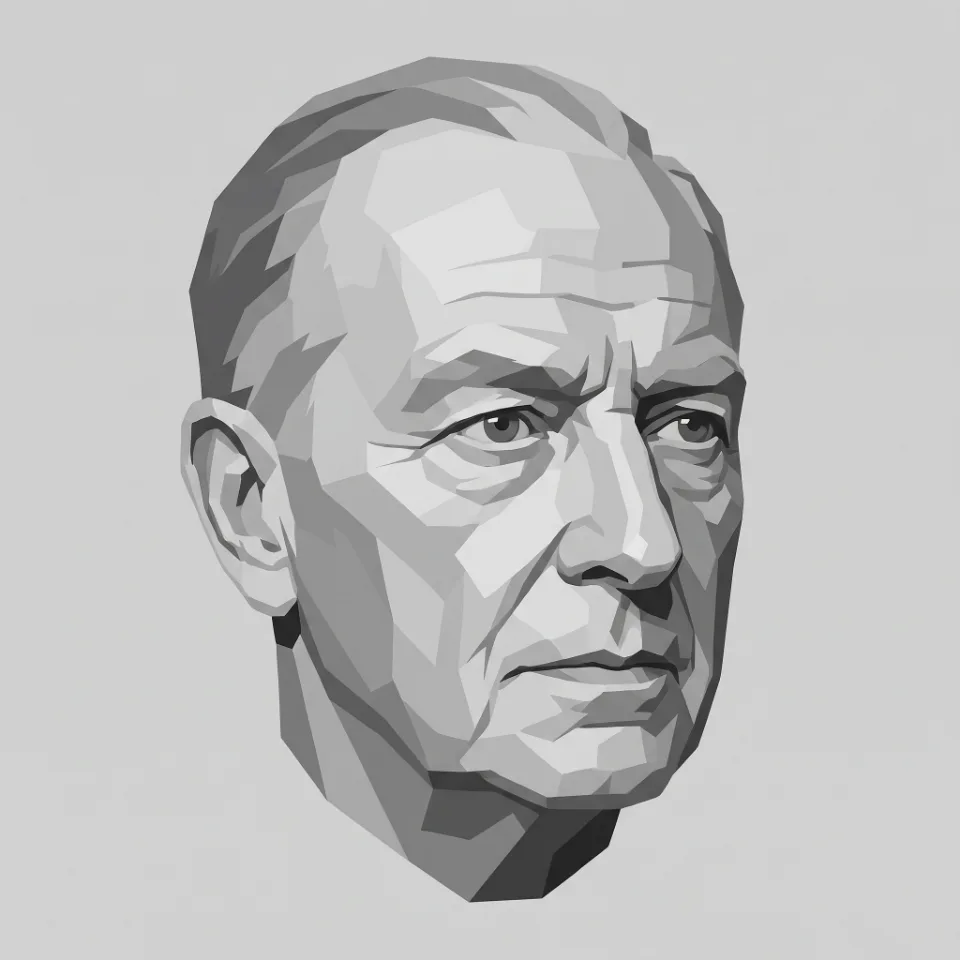
AI illustration: portrait of John Adams
Facts are stubborn things; and whatever may be our wishes, our inclinations … they cannot alter the state of facts and evidence.
John Adams (1735–1826)Closing argument, Boston, 1770 · abridged · evidence level A

New on the market

We are expanding MetrixMundi step by step.

The Online Radar is freely accessible from now on. Reports, the full Radar and further offers will follow one after another. Interested? Then pre-register: we will get in touch at launch and whenever something new is added.

  • Free and without obligation. You make no commitment.
  • Only with confirmation. You will receive an email with a link; only then are you pre-registered.
  • Unsubscribe at any time. Every email contains an unsubscribe link; we then delete your details immediately.

Required: email address and tick box. No disclosure to third parties.

Online Radar

Your region, interactive. From Europe down to the municipality or neighbourhood.

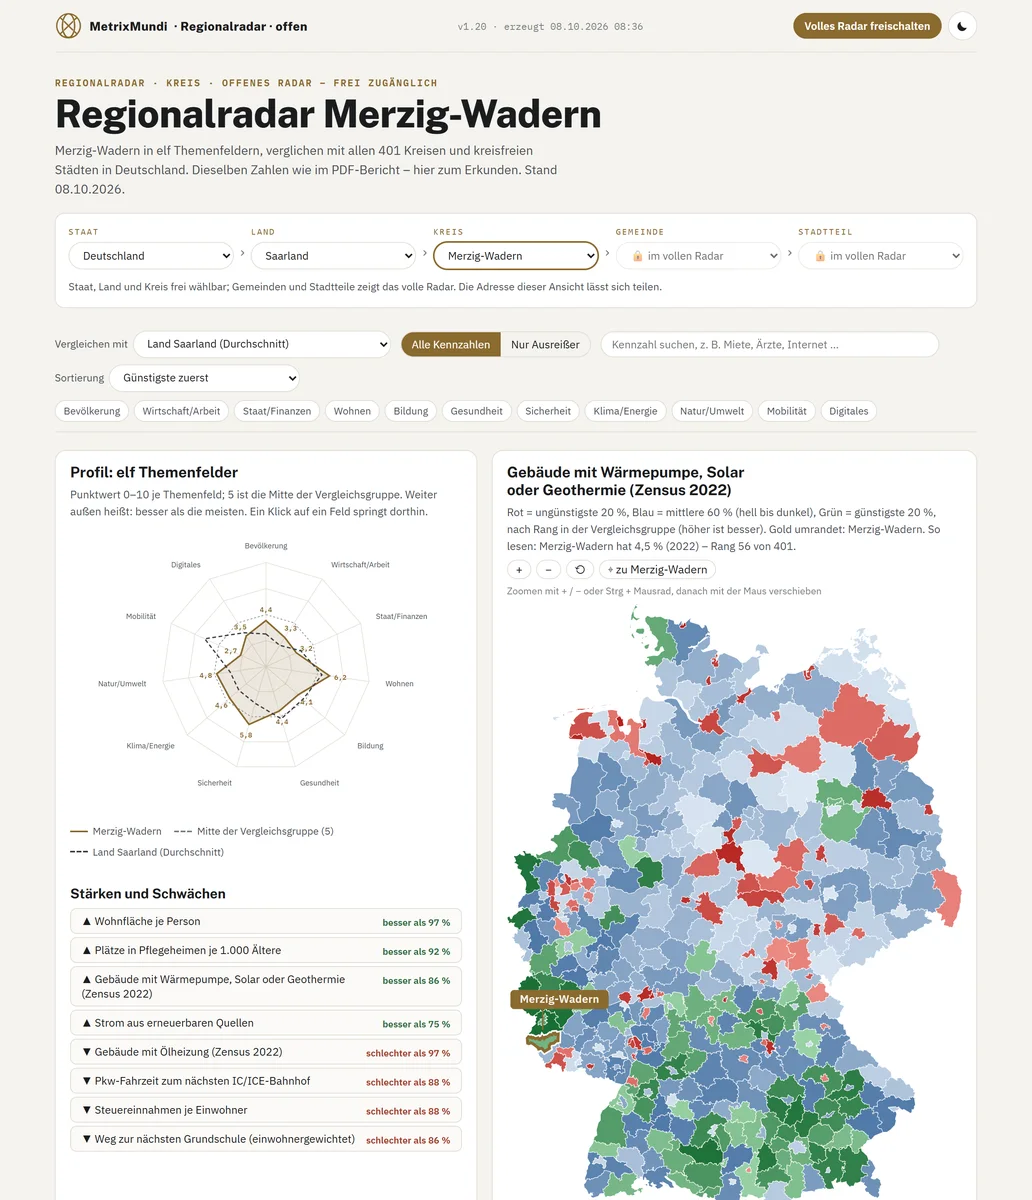
One Radar for everyone: country › state › district. Explore each of the 27 EU member states, each of the 16 German states and each of the 401 districts free of charge – with map, profile, time series and source for selected figures.

The full Radar with all figures, down to the level of municipalities and neighbourhoods, can additionally be booked here.

Country · EU-27

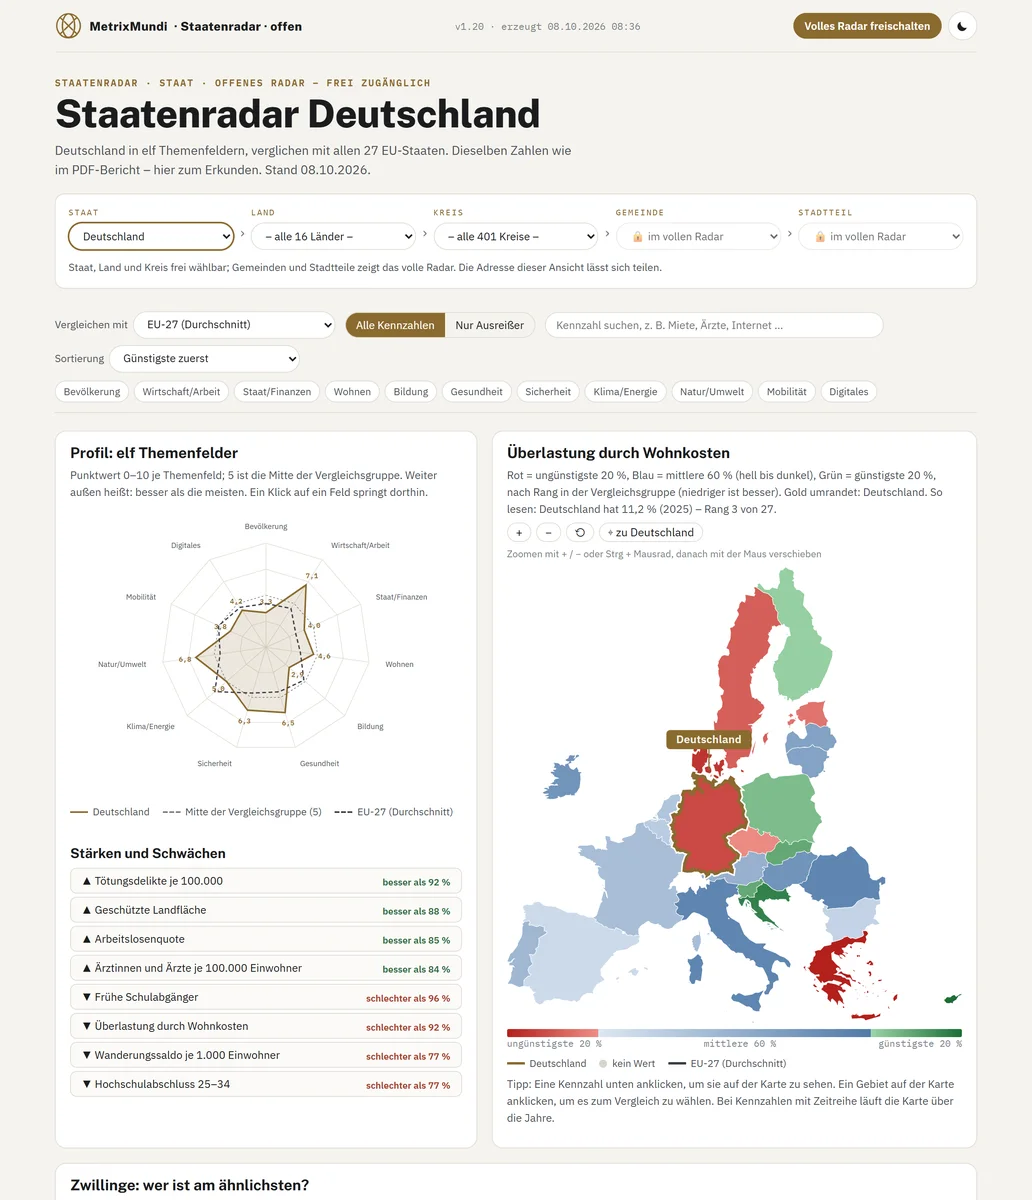
Country Radar Germany

Any of the 27 EU countries can be selected – compared with all of them and with the EU average.

  • 32 key indicators with map, profile, time series and source
  • 9 further indicators, comparison with every country, downloads
View in detail

Federal state · 16 states

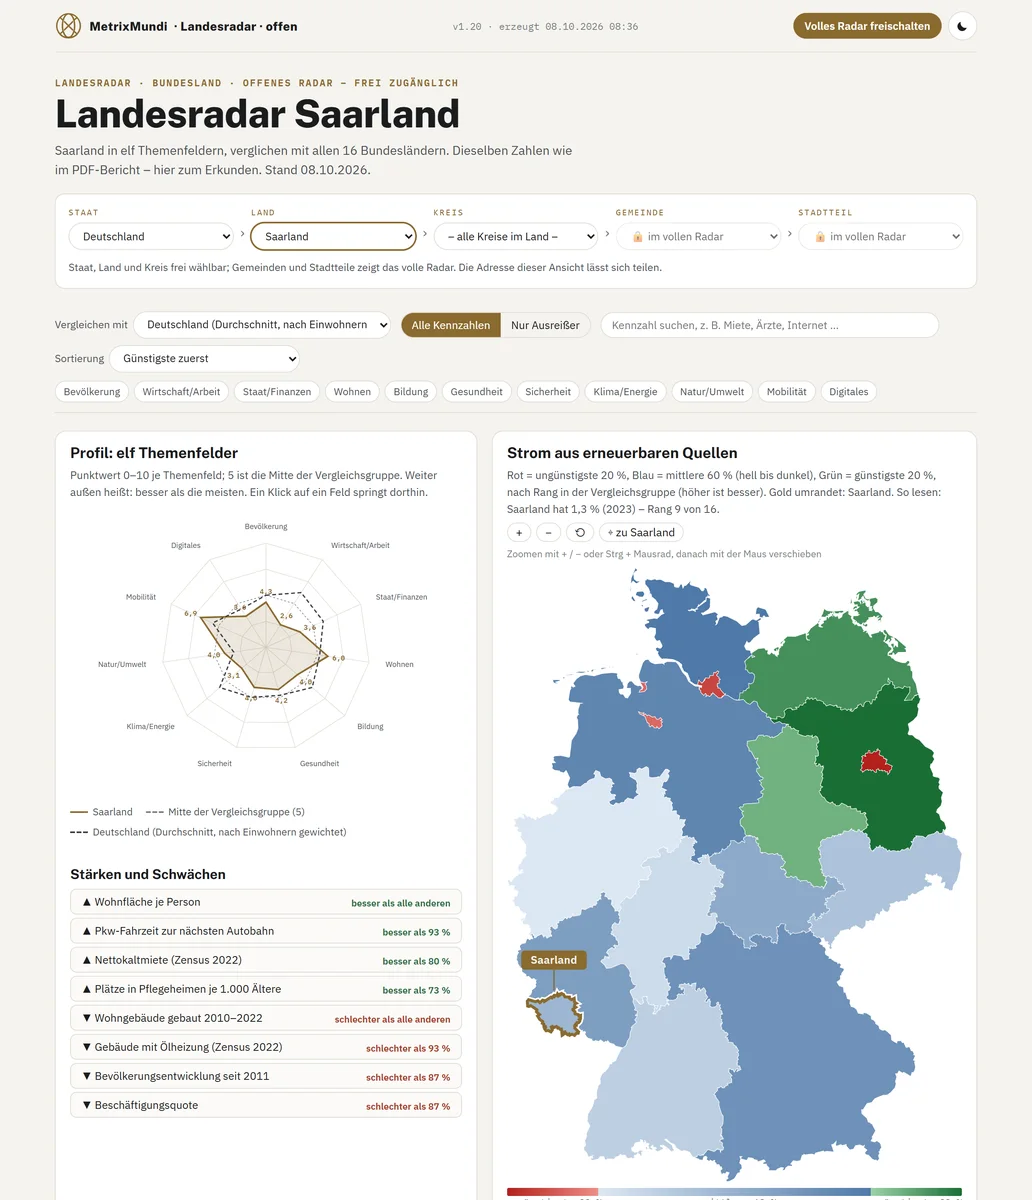
State Radar Saarland

Any of the 16 federal states can be selected – compared with all of them and with the German average.

  • 31 key indicators, map, time series, twins as dots
  • 105 further indicators, comparison with every state, twins with names, downloads
View in detail

District · 401 districts

Regional Radar Merzig-Wadern

Every one of the 401 districts can be selected – on the map with all districts, in the profile with Germany and the EU.

  • 32 key indicators, map, time series, twins as dots
  • 101 further indicators, twins with names, heating module, downloads
View in detail

Municipality · around 10,800 municipalities

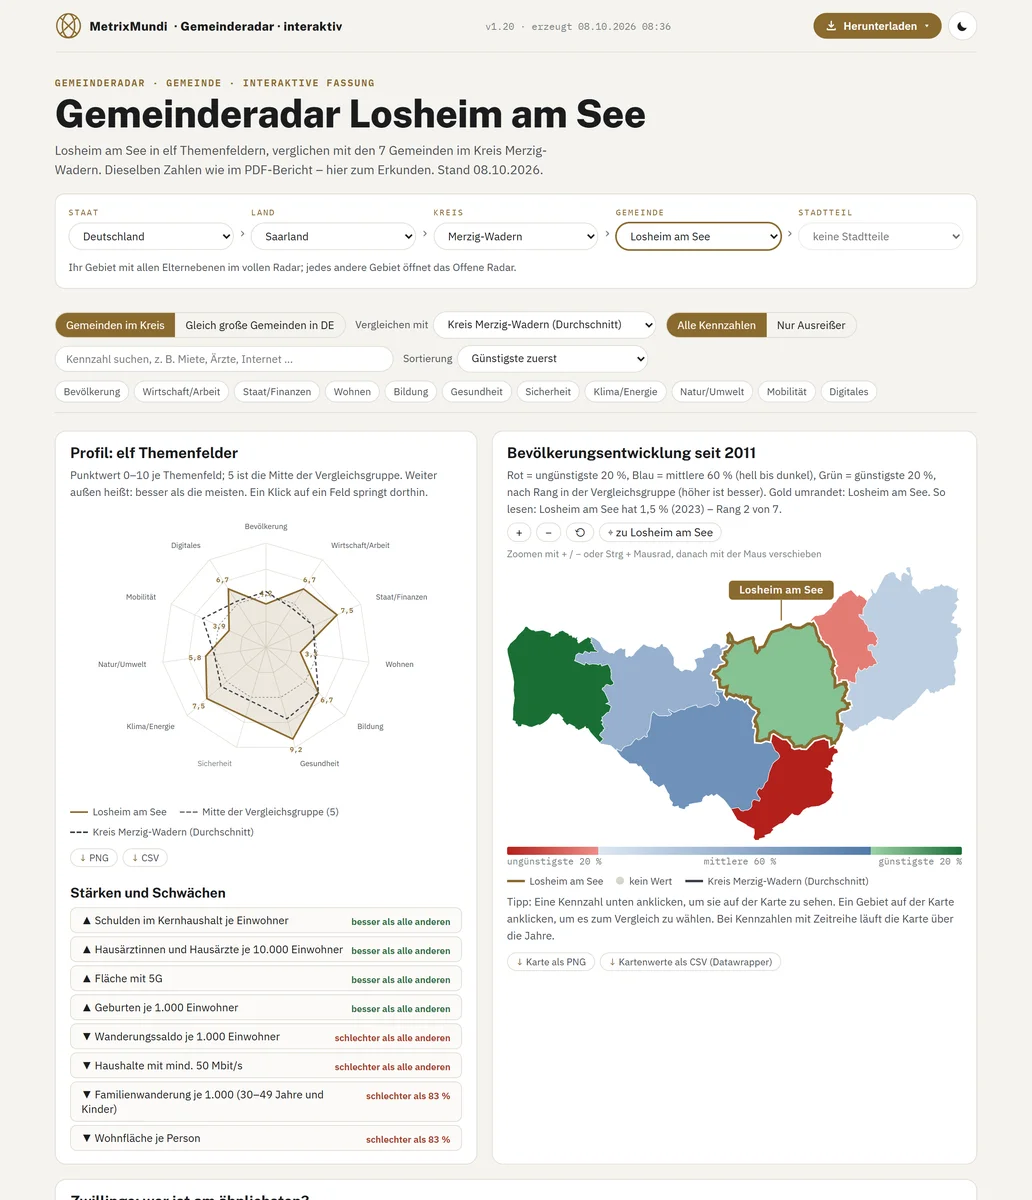
Municipal Radar Losheim am See

Compared with the municipalities in the district and all 891 municipalities of the same size in Germany.

  • Example: this is what the full Radar looks like
  • Municipalities are available only in the full Radar – with every report
View in detail

Neighbourhood · Hamburg, 99 neighbourhoods

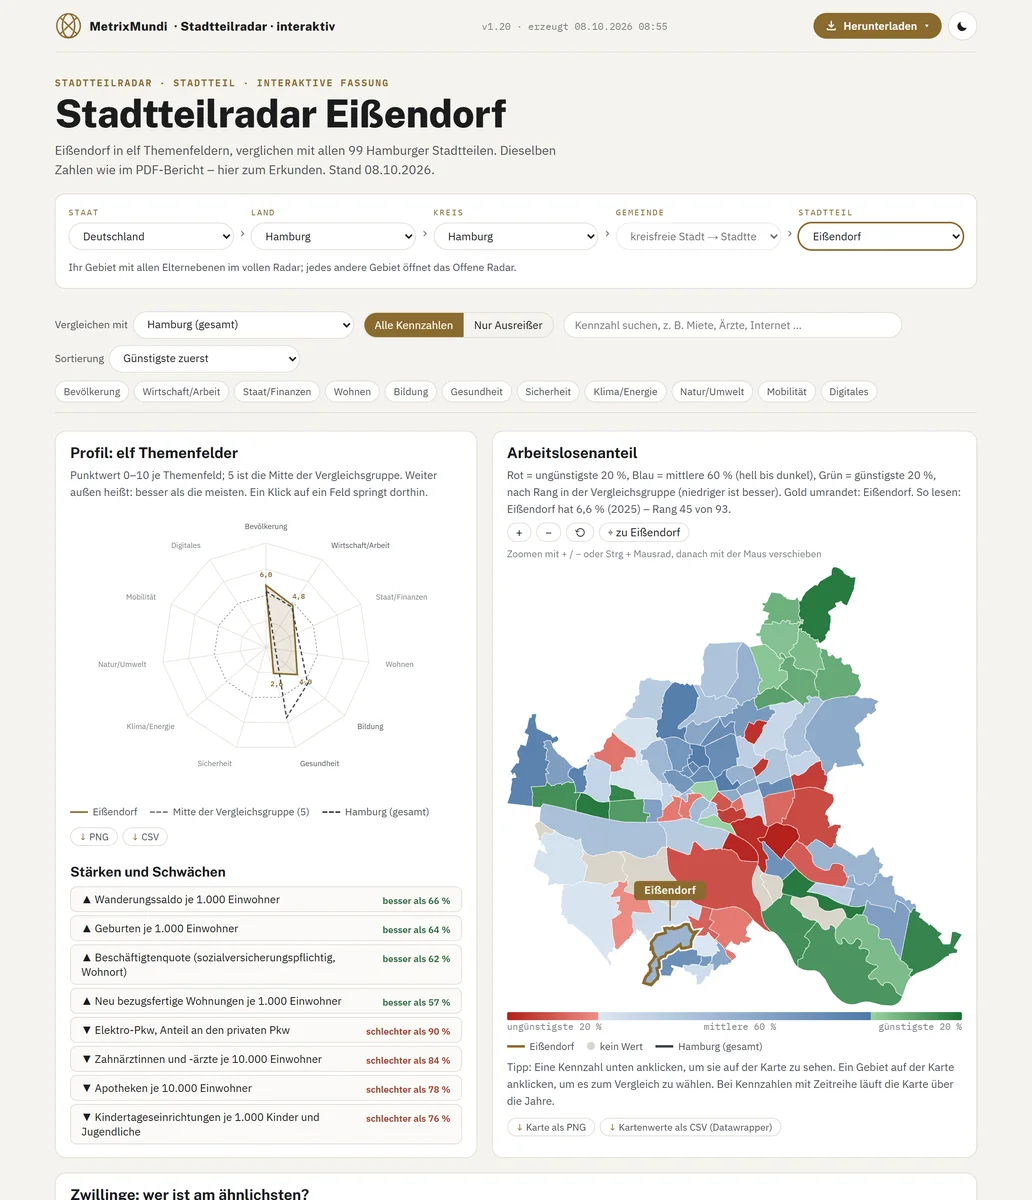
Neighbourhood Radar Eißendorf

Compared with all 99 Hamburg neighbourhoods; twins among neighbourhoods and municipalities across Germany.

  • Example: this is what the full Radar looks like
  • Neighbourhoods are available only in the full Radar – starting with Hamburg
View in detail

Screenshots of the sample pages · a different indicator on each tile · as of 8 October 2026 · Open and full Radar compared

Reports

One report for your area. And a Radar that keeps pace.

Every report describes an area across eleven topic areas, compared with all comparable areas and with a source on every number. As a PDF to share and keep, plus twelve months of the full Online Radar for your area – with the same data as in the PDF, but continuously updated.

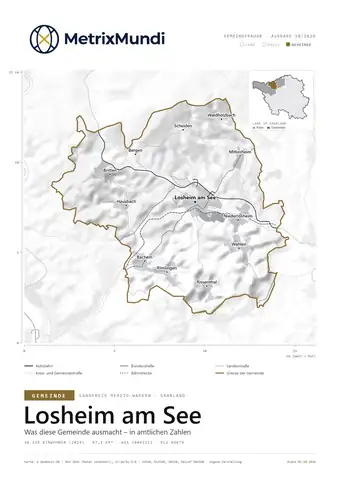
Cover of the Municipal Radar Losheim am See with municipal map, localities and location in Saarland

Municipality and localities

Municipal Radar

A municipality across eleven topic areas, compared with all municipalities of similar size in Germany and the neighbouring municipalities in the district. With maps down to the localities, twins and twelve months of the full Online Radar.

Sample report Losheim am See
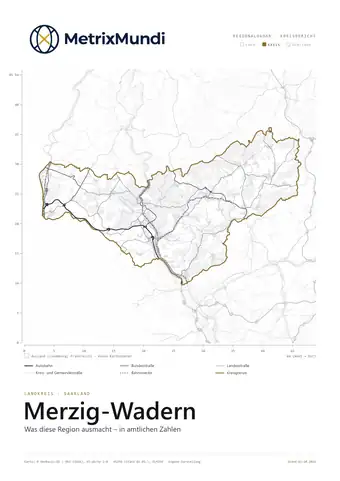
Cover of the Regional Radar Merzig-Wadern with district map, roads and district boundary in gold

District and district-free city

Regional Radar

A district compared with all 401 districts, with the federal state, Germany and the municipalities of the district. For public administration, economic development agencies and the press – with twelve months of the full Online Radar.

Sample report Merzig-Wadern
EconomyClimateNatureDigital
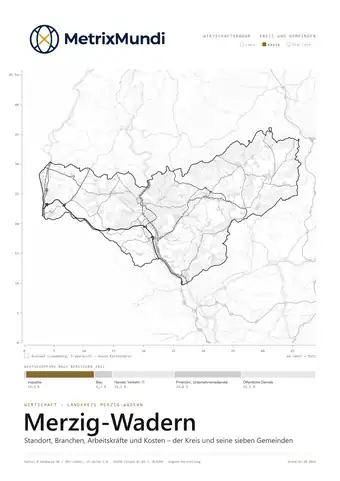
Cover of the focus report Economy Merzig-Wadern in a wide blue frame, with tabs for Economy, Climate, Nature and Digital above it

One topic in depth · each with its own colour

Focus reports

Economic structure and location, climate from 1951 to 2100, energy transition and heating, nature and agriculture, digital infrastructure. From district level upwards.

All sample reports

Offer · rights and prices

Buy once. Keep it. Publish.

No subscription: you buy a report or a package and keep it; every report comes with twelve months of the full Online Radar for your area. All four levels receive the same report – the level only determines what you may do with it.

Who may do what · applies equally to PDF and Online Radar · swipe sideways to compare
Licence levelRead“I read it myself.”Private individualsWork“We use it internally.”Companies, public administration (internal)Publish“We show it to the public.”Local authorities, press, clubs and societiesAgency“We use it for many clients.”Consultancies, planning offices, associations
Read report and Online Radar, twelve months
Profile sheet as PDF
Full report as PDF, data as Excel/CSV, charts for presentations–
Internal use: in the team, in meetings, in closed sessions–
Public display: website, print, social media, public council meetings––
Pass on to an end client, for example in an expert report––
Use for many clients of your own, with your own logo–––

Mandatory at every level: the source line “MetrixMundi, data date …, sources …”.

Prices and packages

Three ways into the Radar.

Open Radar

0 € no account needed

  • Country, state and district to browse
  • three key indicators per topic area, with source

Report

from 39 € one-off, keep the PDF

  • one area as a PDF report
  • municipality, neighbourhood, district, state or Germany

Full Radar

from 59 € 12 months

  • Area or package in full in the browser
  • with PDF report and all updates
Prices by licence level · final prices incl. 19% VAT · businesses deduct the input tax
PackageReadWorkPublishAgency
Report
one area as a PDF, one-off – for example Losheim am See
39 €149 €290 €590 €
+ focus topic for the report
per topic: economy, climate and transformation, nature and agriculture, digital
19 €79 €149 €290 €
Full Radar · single area
one area and all levels above it, 12 months, with PDF – for example Losheim am See with Merzig-Wadern, Saarland and Germany
59 €239 €470 €940 €
District package
one district with all its municipalities and the levels above – for example Merzig-Wadern with its 7 municipalities, plus Saarland and Germany
179 €690 €1.390 €2.790 €
City package
Berlin, Hamburg, Bremen, München or Köln with all neighbourhoods – Hamburg first, with 99 neighbourhoods
990 €3.990 €7.900 €on request
State package S
A state with all its districts and municipalities, plus Germany – Saarland (6 districts, 52 municipalities), Mecklenburg-Vorpommern
590 €2.390 €4.790 €9.590 €
State package M
Saxony, Saxony-Anhalt, Schleswig-Holstein, Brandenburg, Thuringia
1.190 €4.790 €9.590 €on request
State package L
Hessen, Rheinland-Pfalz, Baden-Württemberg, Niedersachsen
2.390 €9.590 €on requeston request
State package XL
North Rhine-Westphalia, Bavaria
3.590 €on requeston requeston request
Germany package
all 16 states, 401 districts and around 10,800 municipalities
5.900 €on requeston requeston request
+ focus topic in the Radar
per topic, for all areas of the booked package
+30 %+30 %+30 %+30 %

Price calculator

Choose an area, choose a use – see the price.

The price depends on the type of area you choose and what you do with it – not on which municipality it is. You choose the exact area after purchase in your account.

1 · Which area?
2 · How deep?
3 · Report or Radar?
4 · What will you do with it?
Add focus reports (from district level)

Full Radar · single area · Read

59 €

Final price incl. 19% VAT

    Full Radar for one municipality or neighbourhood with all levels above it and the EU comparison, 12 months, with PDF report and all updates.

    Select now

    The levels above your area are always included, and so is the comparison with the EU in every package. Focus topics are available as an add-on to a booked area. You can buy from launch – those who pre-register will be the first to know; new data releases are offered on preferential terms.

    Select now

    About usLosheim am See · Greater Region

    MetrixMundi logo

    Two mirrored Ms in a globe ring; the × is formed by their diagonals.

    MetrixMundi. The measure of the world.

    Cambium Holding UG, in the heart of the Greater Region between Saarland, Luxembourg and Lorraine. We work with official sources, check the licence of every dataset and never take a number from a language model.

    More about us
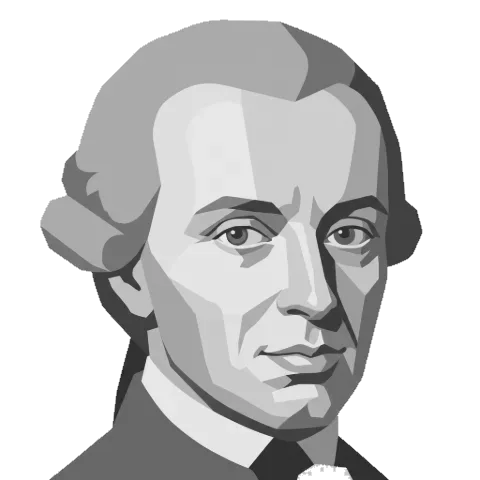
    AI illustration: portrait of Immanuel Kant
    Sapere aude! Have courage to use your own understanding!
    Immanuel Kant (1724–1804)An Answer to the Question: What is Enlightenment?, 1784 · evidence level A

    Questions10 answers

    From official statistical offices, public authorities and registers, international organisations and verified open data sources. Every source is listed in the public source catalogue with its licence, usage class and review date.